


Markets in Focus: Rent Trends in New York City

For our second iteration of our Markets in Focus series, we take a close look at New York City and leverage mapping software to better understand how the apartment market has performed in the past two years.
New York City is known for the densely populated, urban lifestyle that is an economic and opportunity draw to many people, both domestically and internationally. However, with the onset of the pandemic, the New York City apartment market was one of the hardest hit areas as many residents – or soon-to-be residents – opted to forgo city living and move to less-dense or less-expensive areas during the growing uncertainty.
Rent & Occupancy Growth in New York City in 2020 and 2021
As residents left the city, occupancy declined which drove down rents and increased concessions. According to RealPage, occupancy in the New York City metropolitan area declined, on average, by 140 basis points (bps) while effective rents declined an average of -11% in 2020.1 By comparison, during the Great Financial Crisis in 2008-2009, occupancy declined by 210 bps and rents by -9.3%.
Broken down by submarkets, declines in 2020 were most severe in the submarket that made up the heart of the city – New York-White Plains – which includes the five boroughs. Rent declines were not as severe further outside of the city center, with only modest declines in New Jersey. By comparison, Long Island saw positive rent growth in 2020.
In 2021, trends reversed as demand for multifamily housing rebounded. This is partially attributable to pent up demand from the prior year along with lower rent prices and higher concessions helping to entice renters back to the city. On average, rent growth increased 13.8% and occupancy increased 190 bps – a full recovery from the losses in 2020.
Exhibit 1: Effective Rent Growth and Occupancy Change
| Effective Rent Growth | Occupancy Change (bps) | |||
| 2020 | 2021 | 2020 | 2021 | |
| New York City MSA | -11.0% | 13.8% | -140 | +190 |
| New York-White Plains, NY | -13.8% | 15.5% | -150 | +190 |
| Newark-Jersey City, NJ | -2.9% | 8.9% | -90 | +210 |
| Nassau County-Suffolk County, NY | 2.6% | 7.0% | +10 | +40 |
Source: RealPage
Geographic Distribution Redefined
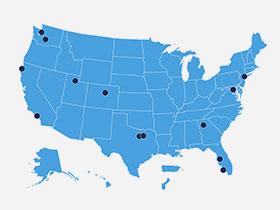
While these geographic boundaries help identify the areas hardest hit by the uncertainty and mobility patterns of the pandemic, they are set based on county definitions and, as such, analysis only based on these boundaries may miss some market dynamics. The New York-White Plains submarket encompasses the five boroughs up to Kingston, New York – roughly 100 miles north of the city center. Meanwhile, Jersey City and other New Jersey submarkets directly across the Hudson River are only 5 miles away. For this analysis, we removed these boundaries and instead calculated rent growth based on distance from the center of New York City. We geocoded properties into buckets based on their radius (in miles) from a common epicenter – the Empire State Building.
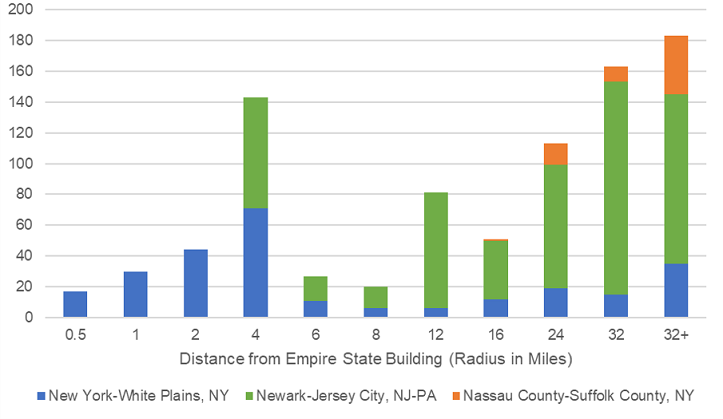
Exhibit 2 shows the breakout by properties from the three metro divisions that make up the broader New York City metro area based on RealPage classifications. Up to 2 miles away, all properties are considered part of the New York-White Plains submarket. Starting between 2 and 4 miles outside of the city center, we see that roughly 50% or more of the inventory is part of the Newark-Jersey City submarket. The Long Island submarket represents a small portion of all properties, starting between 16 and 24 miles away from the epicenter.2
Exhibit 2: Number of Properties by Distance from the Empire State Building by Metro Division
Source: RealPage
Performance Based on Location from Epicenter
Exhibit 3 shows the average effective rent growth in 2020 and 2021 based on the property’s distance from the Empire State Building. The largest declines in rent growth in 2020 were seen in the very epicenter of the city, as shown in Exhibit 3. Within a mile of the Empire State building, rent declines averaged -18.8%. As you move further out from the city center, rent growth declines continued, but at a less severe rate.
In 2021, we almost see a mirror image of the rent growth from 2020: closer into the city center saw the strongest growth rates while further out properties continued to see positive growth rates, but at a lower magnitude. Within a mile of the Empire State building, rents rose an average of 22.3% in 2021. Further out, rents grew at a more manageable level, albeit, still relatively healthy rates, with a minimum average of 5.1%.
Exhibit 3: Average Effective Rent Growth by Distance (Miles) Outside of New York City
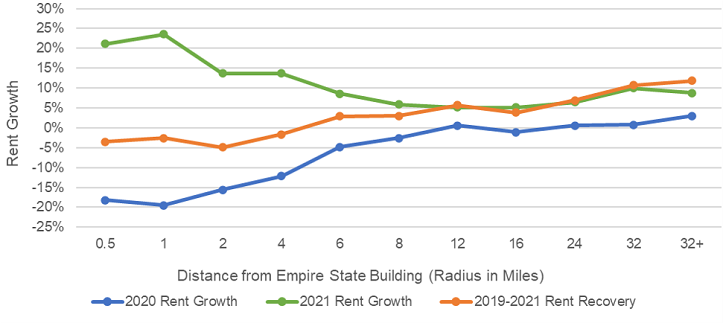
Source: RealPage. Includes properties that had an effective rent observation for the fourth quarter of 2019 and 2021.
While the overall New York City metropolitan statistical area fully recovered in 2021, we can see in Exhibit 4 that closer into the city center, up to 4 miles outside of the Empire State Building, rents have not yet recovered from the declines seen in 2020, regardless of the submarket. The closest submarkets in New Jersey to the Empire State Building (between 2 and 4 miles) were still below their 2019 rent levels. Starting between 4 and 6 miles outside of the city center, rents generally recovered, although the New York-White Plains submarket continued to see declines between 6 and 8 miles outside of the city center (although, as seen in Exhibit 2, this represents a very small number of properties).
Exhibit 4: 2019-2021 Effective Rent Recovery by Distance (Miles) Outside of New York City by Submarket
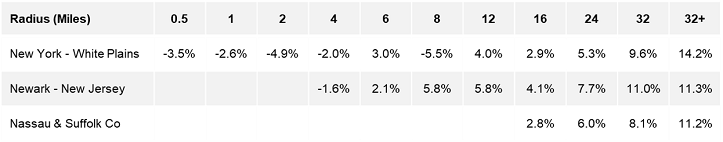
Source: RealPage. Includes properties that had an effective rent observation for the fourth quarter of 2019 and 2021.
Layering occupancy on top of rent growth – computing a gross income rate – provides further analysis into an all-in recovery rate between 2019 and year-end 2021.3 Even with the strong occupancy growth layered in, full recovery has yet to materialize within the 2-mile radius of the city center. Likewise, the distribution of recovery rates across the properties is much more varied closer to the city center compared with the distribution further out. On average, full recovery begins between 2 and 4 miles from the center where year-end 2021 effective rents adjusted for occupancy are back in line with the average 2019 effective rents adjusted for occupancy.
Exhibit 5: 2019-2021 Effective Rent and Occupancy Change
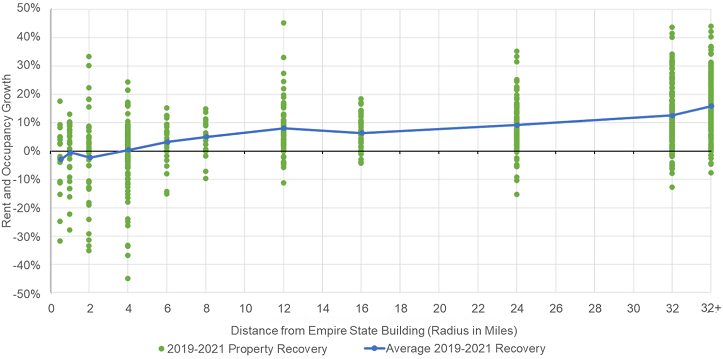
Source: RealPage
Conclusion
The rebound in the New York City rental market occurred much faster in 2021 than originally anticipated. As residents returned to the city, demand increased, driving up occupancy and rent growth. Areas closer to the center of the city, which is typically associated with smaller, denser living arrangements, were hardest hit in 2020 but saw the strongest growth rates in 2021. On average, properties closer to the city center have not yet fully recovered despite the broader metro area’s recovery. However, as people continue to return to the office and the effects of the pandemic wane, we expect the multifamily housing demand to continue to increase and the apartment market to grow through 2022.
1 The trough in occupancy and rent declines was reported in the first quarter of 2021, however, here we keep the annual growth rates for the years 2020 and 2021 for simplicity.
2 Between 4 and 8 miles outside of the city, we see a smaller number of properties captured. This corresponds to areas outside of Jersey City but before Newark, as well as the majority of Brooklyn and Queens. The latter two boroughs are more heavily dependent on smaller properties not captured by RealPage.
3 This analysis removes properties that were most likely in lease-up during 2019 (with occupancy rates below 80% as of the first quarter of 2019) along with those properties that had missing data or extreme outliers. In this analysis, the recovery level is set as the average 2019 effective rent adjusted for occupancy.