Our Results
Freddie Mac Multifamily’s solid performance and continued risk management activities provide liquidity and stability to the multifamily housing market.
![]()
Creating liquidity in every corner of the rental market
![]()
Financing rental units in large, medium and small markets
![]()
Supporting U.S. households with affordable rental housing
![]()
Reducing credit risk on our mortgage portfolio
Monthly New Business and Affordable Financing Reports
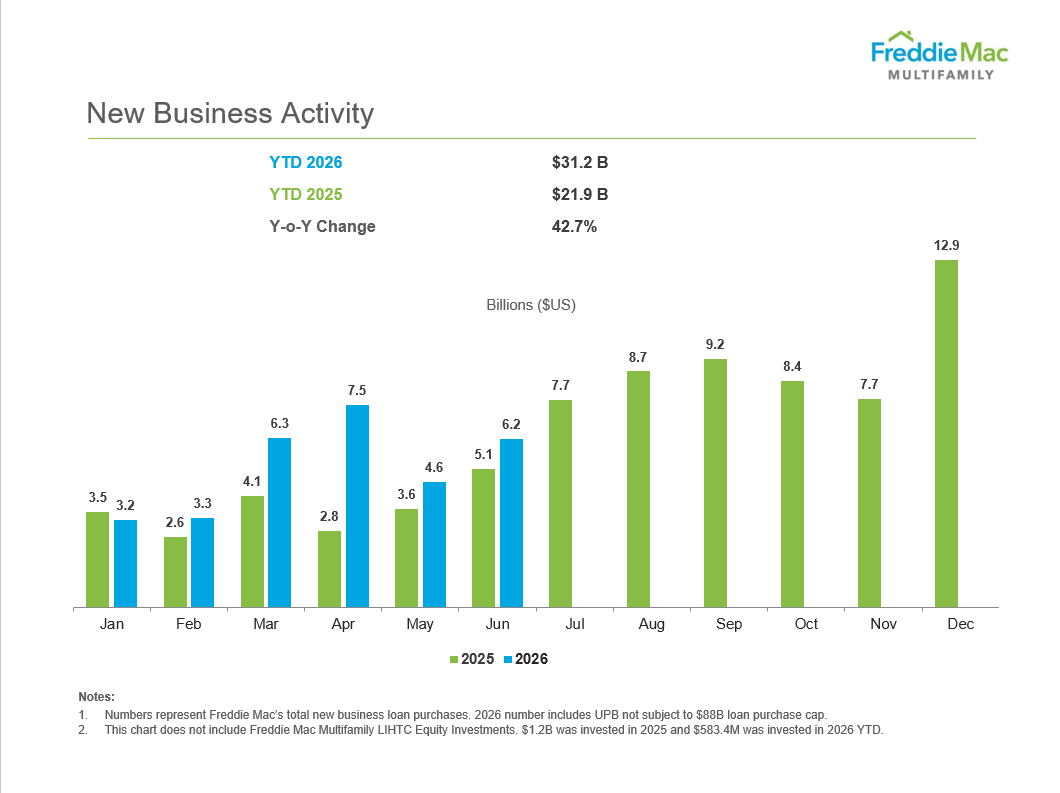
New Business Activity
See our new business activity by month through June 2026.
Download to see our new business activity
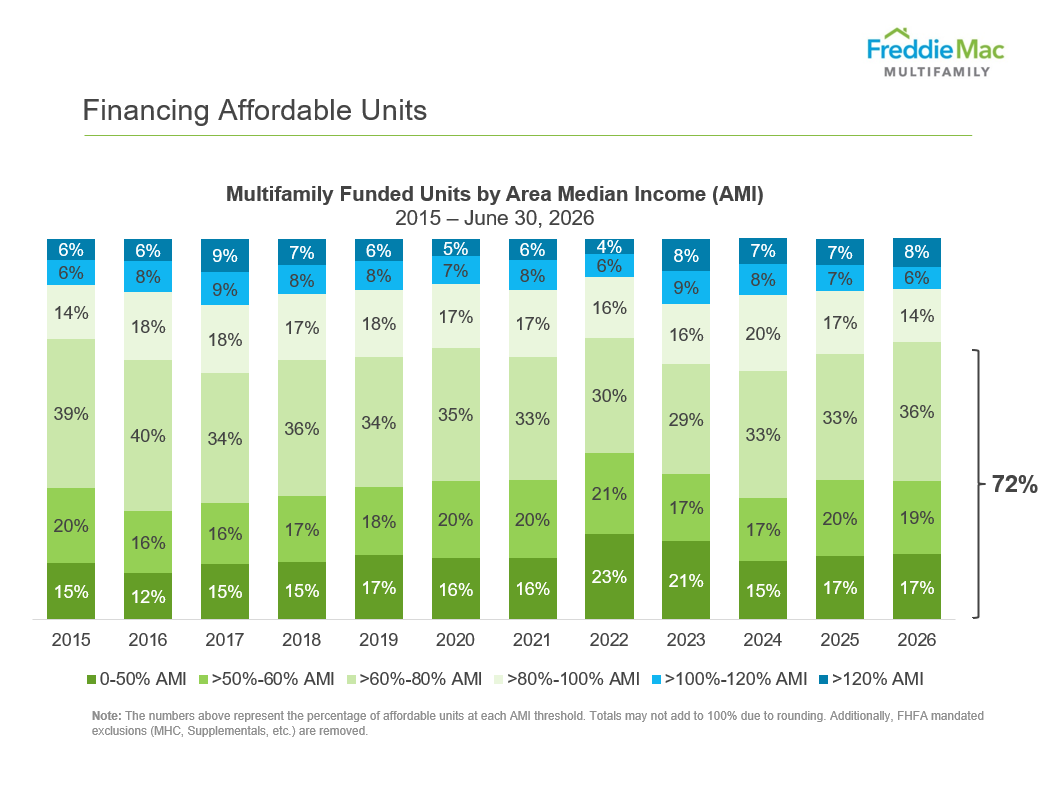
Funded Units by Area Median Income
See our financing of affordable units by month through June 2026.
Download to see our financing of affordable units by month
1Q 2026 Multifamily Performance Highlights
$575M
comprehensive income
$13B
new business activity
99K
rental units financed
93%
of rental units financed were affordable
$498B
mortgage portfolio
0.43%
delinquency rate
2025 Multifamily Results

Freddie Mac Earning Releases
Our performance supports liquidity, stability and affordability in U.S. housing. See financial results highlights, listen to the webcast, read remarks from our chief financial officer and more each quarter.
See Corporate Earningsmore releases
Connect With Us
Get the latest news and updates delivered to your inbox or from our LinkedIn® Showcase page.