2023 Multifamily Outlook Update
Since we released our 2023 Outlook in December, the multifamily industry has continued to slow down as anticipated while the overall economy remains stable. Given the recent data, we are providing an update to the report that considers the changes and sentiment we are seeing since we released the 2023 Outlook.
Economic Resiliency Tested
The economy has continued to perform well into early 2023. Gross domestic product grew at about 3% annually during the third and fourth quarters of 2022 after it contracted during both the first and second quarters. Inflation was essentially flat during the fourth quarter of 2022 but was still up more than 6% for the year. The Federal Reserve has continued to raise interest rates, albeit at a slower pace recently, while the 10-year Treasury rate has averaged about 3.5% in January 2023. But given recent economic indicators and Fed talking points, rate increases may be more substantial and/or there will likely be more of them than pervious anticipated. Ultimately it is believed that the federal funds rate will top out in the 5.5% to 6.0% range.
The labor market continues to be a bright spot for the economy despite headline-grabbing layoff announcements at large tech companies. With the strong job market, weekly unemployment claims have been low, and the unemployment rate sits at just 3.4%, the lowest rate since May 1969. Wage growth is still elevated at 6.1% for the year ending in January 2023 but has moderated from the nearly 7% growth seen earlier in 2022.
The Multifamily Market Continues to Slow
At the end of 2022, we believed the apartment market had reached an inflection point. Rent growth and occupancy rates per RealPage slowed throughout the last quarter of the year. Rents contracted -1% in the fourth quarter, which, on average, is a larger decline than the typical seasonal slowdown. Meanwhile, occupancy rates decreased 70 bps in the quarter. These trends are not universal; Reis reported positive rent growth in the fourth quarter, up 2%, and that occupancy declined only 10 bps, while Yardi Matrix closely mirrors RealPage’s sentiment with rent growth down -0.4% during the fourth quarter.1
Exhibit 1: 2022 Rent Growth and Occupancy Change
| 4Q 2022 | 2022 | ||||
| Data Provider | Rent Growth | Occupancy Rate | QoQ Occupancy Change | Rent Growth | YoY Occupancy Change |
| RealPage | -1.0% | 95.1% | -0.7% | 6.6% | -2.3% |
| Reis | 2.0% | 95.5% | -0.1% | 9.7% | 0.3% |
| Yardi | -0.4% | 95.2% | -0.2% | 6.4% | -0.9% |
Sources: Freddie Mac, RealPage, Reis, Yardi Matrix
Note: Quarter over quarter (QoQ) and year over year (YoY)
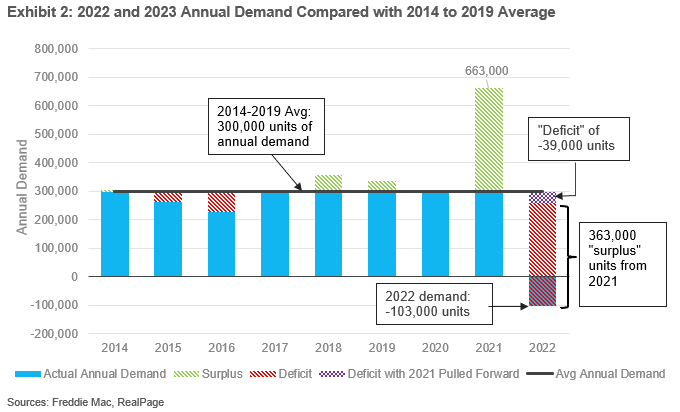
The decline in rents as reported by RealPage is due to negative net absorption which started in the second quarter of 2022. Demand for all of 2022 totaled negative -103,000 units. However, in 2021 RealPage reported record-shattering levels of demand, at 663,000 units, more than twice as much as the historic annual average demand seen from 2014-2019, at 300,000 units. Combining demand across 2021 and 2022, total demand was about 39,000 units less than the prior five-year average (2014-2019), seen in Exhibit 2.
Looking forward, rent growth expectations from some external vendors have shifted down since the 2023 Outlook. The most recent RealPage and Yardi forecasts for 2023 indicate rent growth of 2.6% to 2.9%, whereas they were between 3.1% to 3.6% during the third quarter of 2022. Meanwhile, vacancy rate forecasts haven’t moved much and are expected to remain relatively stable. The downward revisions can be attributed to the more rapidly than expected slowing of market conditions during the fourth quarter and the increasing likelihood of slowing economic growth in 2023.
The Multifamily Investment Market Adjusting
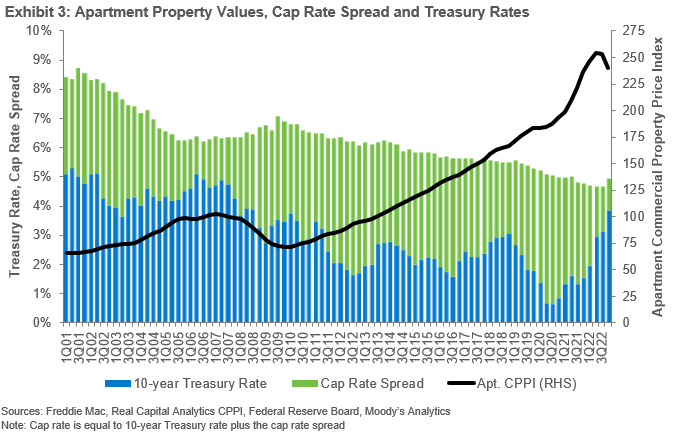
Real Capital Analytics (RCA) reported cap rates increased 25 bps in the fourth quarter of 2022, the first quarterly increase since 2010. Despite the increase in cap rates, cap rate spreads, the difference between the cap rate and 10-year Treasury rate, declined to 110 bps given the increase in interest rates during the fourth quarter. This increase in cap rates indicates the market is starting to price in the higher Treasury rates but given cap rates were sticky throughout most of 2022, reported cap rates have been slow to pick up changes. However, we have heard from market participants that average cap rates increased by 70-80 bps from September 2022 through January 2023.
As cap rates increased, property values contracted. RCA’s apartment Commercial Property Price Index (CPPI) reported property prices declined -4.9% in the fourth quarter. Revisions to prior data show the decline may have started in the third quarter, with property prices down slightly by -0.1%. The increased market uncertainty and sticky cap rates throughout 2022 slowed the origination market. RCA reported that multifamily volume during the second half of 2022 was 23% lower than it was during the first two quarters of the year given the rising interest rates and moderating asset performance. The Mortgage Bankers Association lowered their 2022 volume projections to $439 billion, a decline of -10%. We expect the decline in property prices to continue throughout 2023, which will lower 2023 volume to around $400 billion.
Conclusion
While the strength of the multifamily market in 2023 will be mostly dependent on the strength of the labor market, there still exists other headwinds, such as high inflation and high levels of new supply. The state of the multifamily market at the end of 2022 and into early 2023 follows mostly in line with our expectations, with slowing rent growth, decreasing occupancy rates and increasing cap rates. Our expectation for the rest of the year remains stable and will be dependent on if we avoid a recession, and specifically that the labor market remains healthy. As the economy has avoided a recession so far, we believe the tailwinds will keep the multifamily market performing in 2023, but at more modest levels compared with the prior few years.
1 Variation in the results reported by the data providers may be partially attributable to survey methodologies and geographic differences, but also due to inconsistency within a rapidly changing market.
Connect With Us
Get the latest news and updates delivered to your inbox or from our LinkedIn® Showcase page.