


Our Results
January 1 through December 31, 2023

We had a strong year as we continued to focus on our mission.
Below, we describe 2023 results.
Angela Jacks
Multifamily Chief Financial Officer
Contact me for more information or clarification.
million
comprehensive
income
We continued to generate solid returns for U.S. taxpayers.
credit
results
Our credit profile remains strong as of December 31. We had minimal credit losses ($1 million), no REO properties on the books and our delinquency rate was 28 basis points.
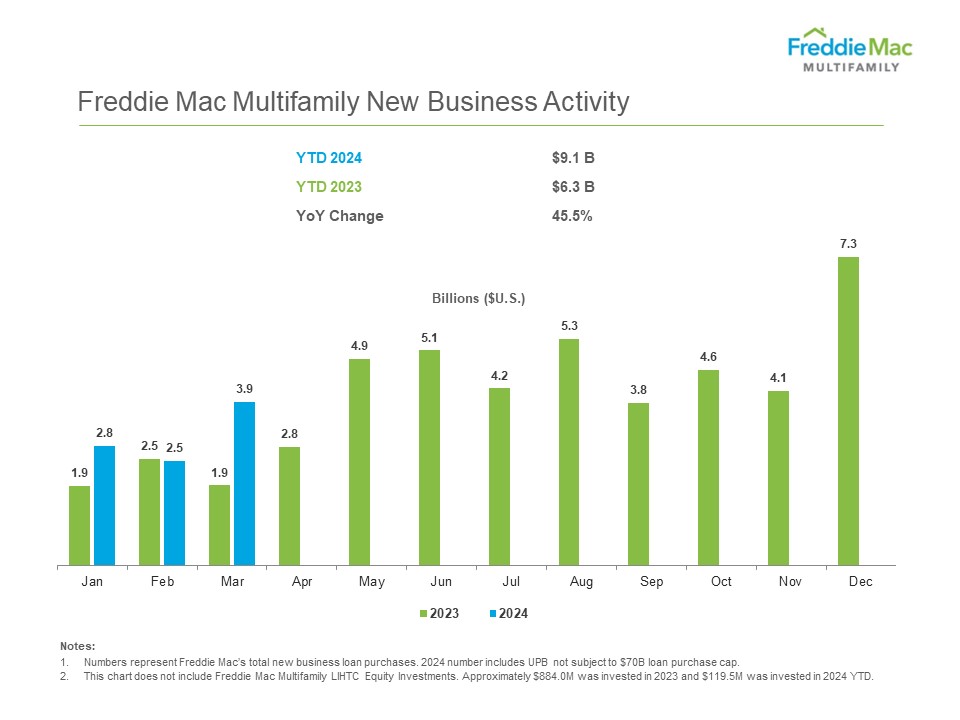
billion
new business
Our loan purchases created liquidity in virtually every corner of the rental market.
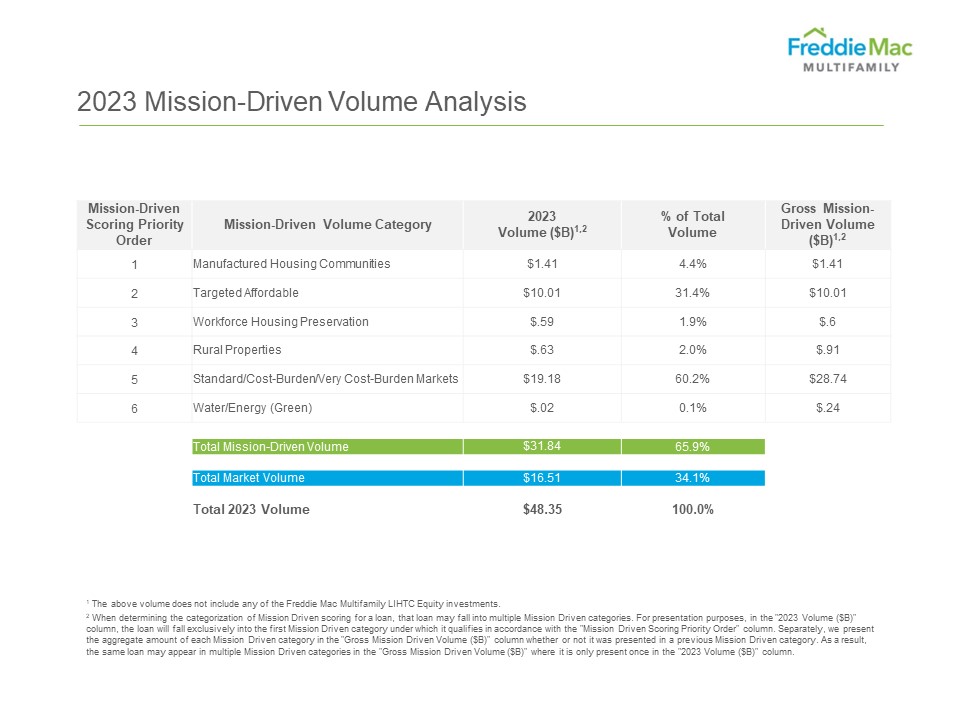
mission-driven, affordable housing
About 66% of the 2023 new business activity, based on UPB, was mission-driven, affordable housing.
affordable
More than 9 in 10 eligible units we financed supported U.S. households earning at or below 120% of area median income.
rental
units
We financed rental units in a wide variety of large, medium and small markets.
billion
credit risk transfers
Since inception of our K-Deal® program in 2009, the company has cumulatively transferred a large majority of credit risk on the multifamily guarantee portfolio.
billion
multifamily mortgage portfolio
94% of our mortgage portfolio covered by credit enhancements.